

Recently we at Stanza have been exploring operational data, and it's been really exciting to bring techniques and ideas from other domains into our domain - production systems generally, traffic, alerting, cloud costs, etc.
The thing we’ve been looking at most recently is a thing called Benford’s Law. If you have a background in finance, you might have come across it already, since it’s used a lot in fraud detection. Long story short - and I want to make clear I am mangling all kinds of mathematical nuance here - Benford’s Law asserts a property that holds true for certain kinds of real-life number sets. To wit, in aggregate, their first digit is likely to start with 1 with probability ~30%, 2 with probability 18%, and so on. (See the Wiki link for more.)
This does seem a bit bizarre on the face of it. Indeed, it's not always easy to understand how or why something will or won't obey Benford, but if we put that to one side for a moment, you can do a lot with it.
Let's come back to the fraud detection example. The reason it’s so useful when folks are committing numeric-based crimes is they don’t often make sure that the fake numbers they have lined up for audit actually obey Benford. Or to put it another way, non-Benford distributions can sometimes be a sign that an otherwise natural process is being interfered with. In the case of fraud, it’s obviously arbitrary human interference, but it could also be structured human interference (corporate processes), acts of computer (truncating data), or similar.
Now let us turn to the world of incidents, where applying numeric analysis is fraught with danger - see, for example, Stepan and Courtney’s work on MTTR - but, like a moth to the flame, I see something potentially illuminating, so here we go!
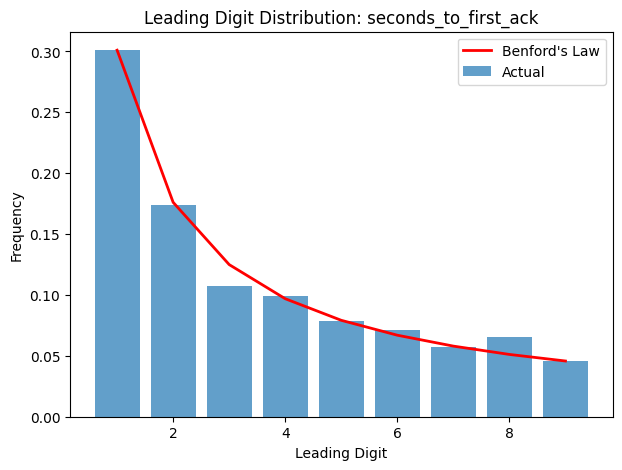
So we graphed it. When we did, we saw that the “seconds to first acknowledgement” graph closely (but not exactly) follows Benford’s Law. On reflection, this is plausible: it’s a random process, with several orders of magnitude of variance available - there’s no reason to expect truncation or similar "interference".
However, incident duration does not:
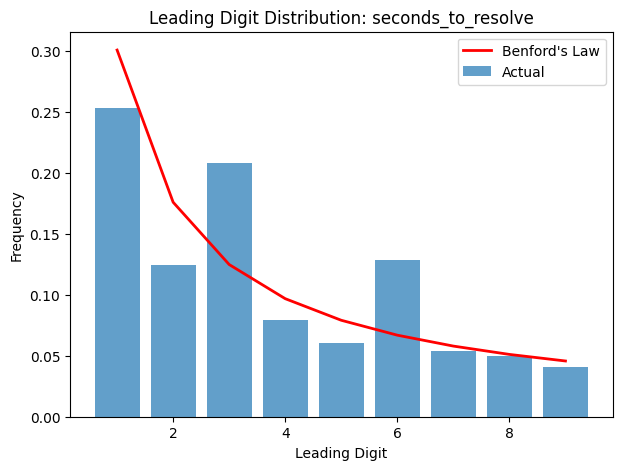
In our data, there are significant spikes at initial digits 3 and 6. I don’t know why, but one guess I’ve been playing with is that there are spikes at ‘30’ and ‘60’. This might imply that enough incidents are reviewed and their duration perhaps truncated, clamped, or otherwise post-hoc determined by either corporate process or automation action such that the distribution doesn’t follow Benford.
Without further context (which in our case would need to be supplied by the client), we can’t provide further ideas as to why, or whether or not it’s worth fixing. However, we thought it was an interesting technique to use to look at certain kinds of data and understand whether or not processes of some kind are interfering with its “natural” distribution.
